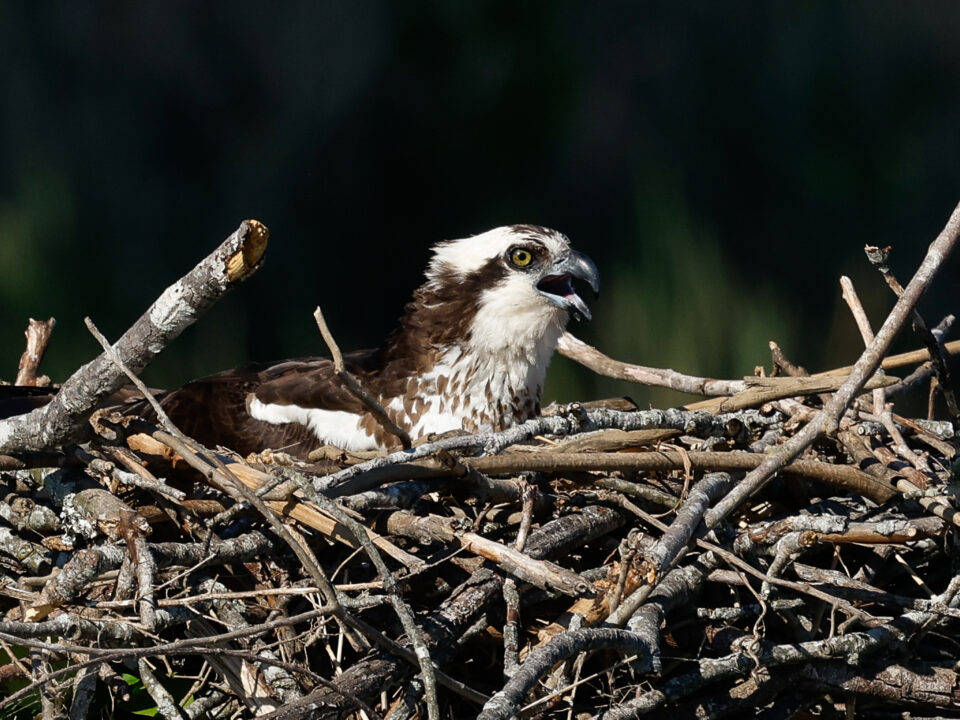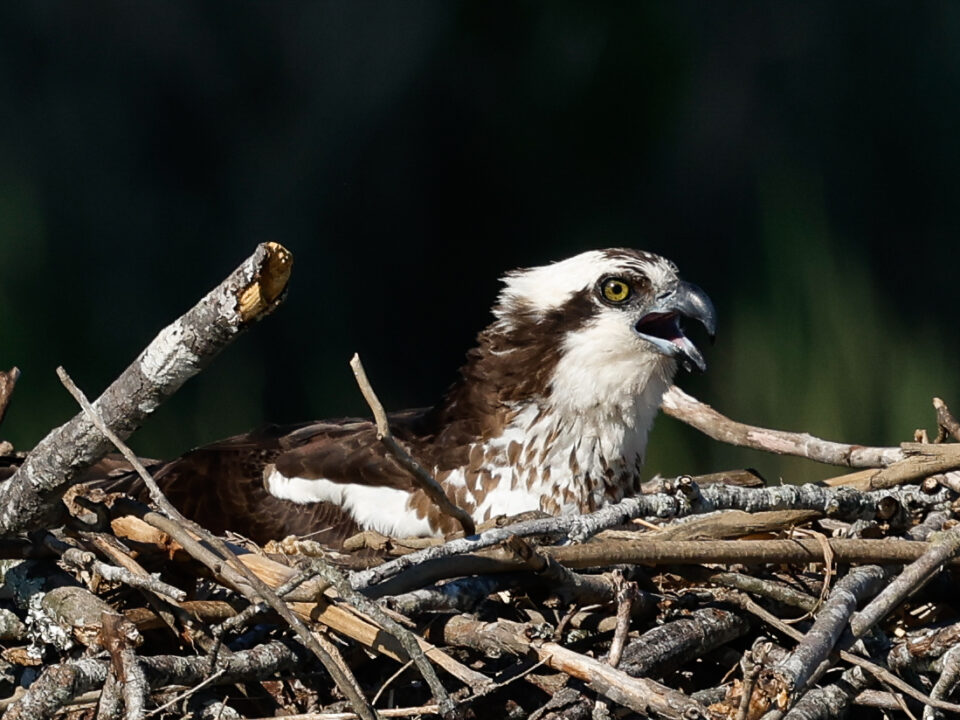
2026 osprey breeding performance was the worst ever recorded for the Chesapeake Bay
September 14, 2026News Advisory
FROM: The Center for Conservation Biology, William & Mary
FOR IMMEDIATE RELEASE: 18 September 2026
MEDIA CONTACTS:
Dr. Bryan D. Watts, Director
The Center for Conservation Biology
William & Mary
bdwatt@wm.edu
(757) 221-2247
Osprey starvation reaches northern mid-Atlantic and southern New England
2026 osprey breeding performance along the Atlantic Coast
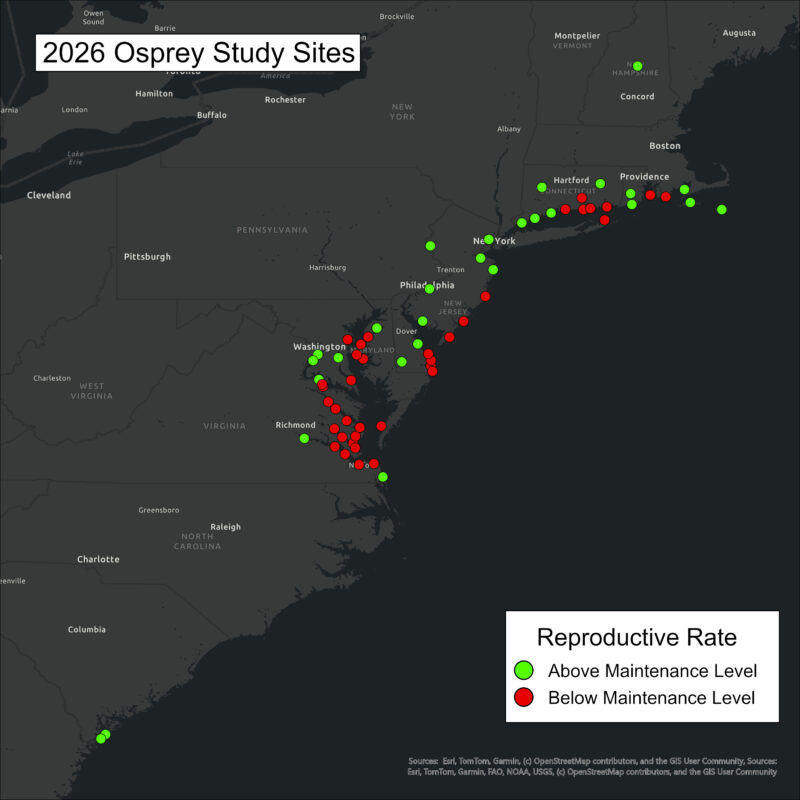
(Williamsburg, VA)— The Center for Conservation Biology at William & Mary has compiled the 2026 breeding performance results for osprey populations along the Atlantic Coast of North America. Within the Chesapeake Bay, breeding performance in ospreys has been poor for several years due to extreme food stress during the nesting season. Productivity has declined to critical levels that now threaten the stability of the largest osprey breeding population in the world. The primary objective for compiling osprey monitoring results for the broader Atlantic coast is to visualize breeding performance at scale and address the question “Are ospreys experiencing reproductive deficits in waters beyond the Chesapeake Bay?” The 2026 effort includes monitoring results for 2,886 pairs from 65 study areas across 10 states (Table 1, Figure 1).
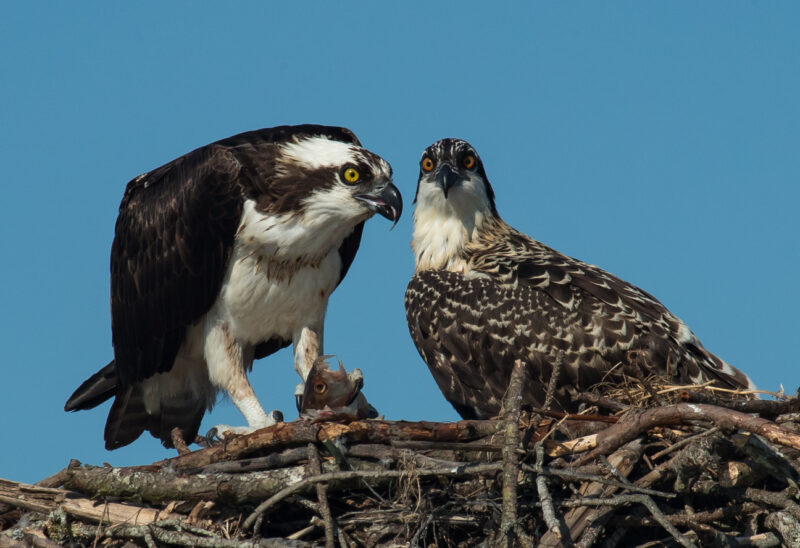
Adult female feeding Atlantic menhaden to nestling on the Chesapeake Bay. Photo by Bryan Watts.
Maintenance Reproductive Rates for Osprey
On a global scale, the annual breeding performance required to maintain a stable osprey population ranges from 0.8 to 1.3 young/pair depending on the specific location. We adopt the most optimistic (0.8 young/pair) reproductive rate as the “break even” threshold. The monitoring effort compiled here includes data from a wide variety of sources including academic institutions, government agencies, NGOs and private citizens (Table 1). Our focus is on breeding outcomes of the 2026 season rather than on clutch sizes, hatching rates, etc. Although nest visitation schedules varied somewhat between monitoring programs, we included only data sets that provided clear season outcomes. Estimates of reproductive rates should be considered optimistic. We have only monitored the survival of young to fledging and there is increasing evidence that post-fledging survival may be low. In addition, some programs only monitored pairs that made breeding attempts which in some populations may underestimate the population size and by doing so overestimate reproductive rates (Table 1).
Figure 1. Distribution of study areas with available osprey monitoring data for the 2026 nesting season. Monitoring was conducted by a wide range of contributors. Data presented includes 2,886 nesting pairs within 65 study areas across 10 states. Colors denote whether or not pairs exceeded the reproductive rate (0.8 young/pair) required for population maintenance.
Breeding Performance
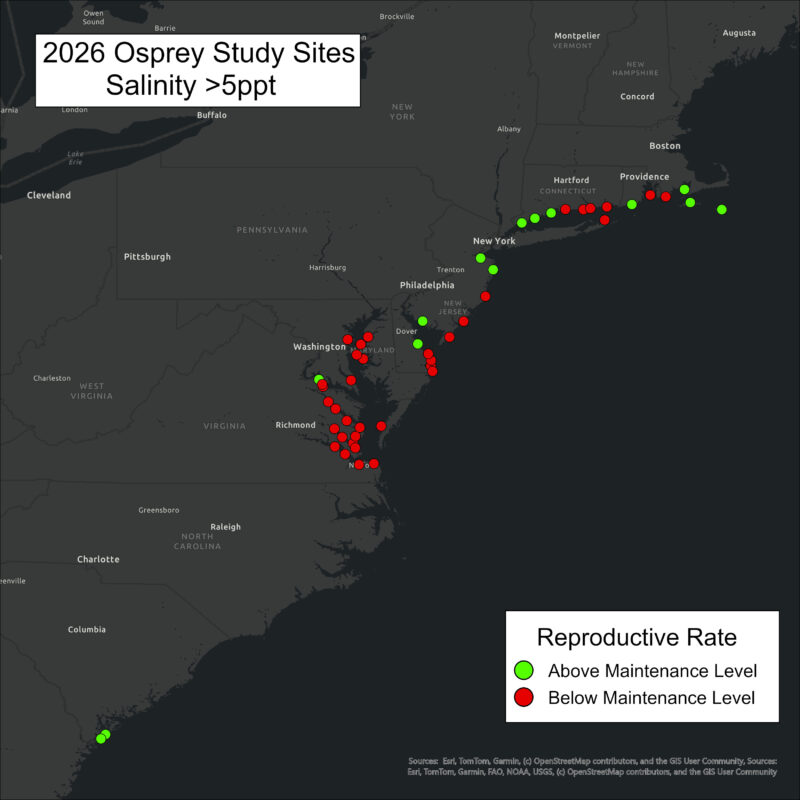
The coast-wide sample of 2,886 pairs collectively produced 1,936 young resulting in an average reproductive rate of 0.67 young/pair. Success rate (portion of pairs that fledged at least 1 young) was 44.5%. Breeding performance was influenced by salinity. Fifteen study areas (405 pairs) were located within freshwater or tidal fresh systems and 50 study areas (2,481 pairs) were located within tidal waters (coastal marine) with salinities above 5 parts per thousand (ppt). Pairs nesting within freshwater systems produced an average of 1.15 young/pair compared to only 0.59 young/pair in salty or marine systems. More importantly for population stability, all but one (93%) of the freshwater study sites produced more young than needed for population maintenance (minimum 0.8 young/pair, see below) compared to only 28% (14 of 50) of saltier sites. Regions along the coast that are experiencing reproductive deficits include the Chesapeake Bay, the Atlantic coasts of Delaware and New Jersey, outer Long Island, the Connecticut coast north of the Quinnipiac River and coastal systems between Narraganset Bay Rhode Island through Buzzards Bay Massachusetts (Figure 2). The Atlantic Coast of the Delmarva Peninsula in Virginia is not shown because the population has collapsed by more than 90% over the past 20 years.
Figure 2. Distribution of study areas within waters above 5 ppt salinity. Colors denote whether or not pairs exceeded the reproductive rate (0.8 young/pair) required for population maintenance.
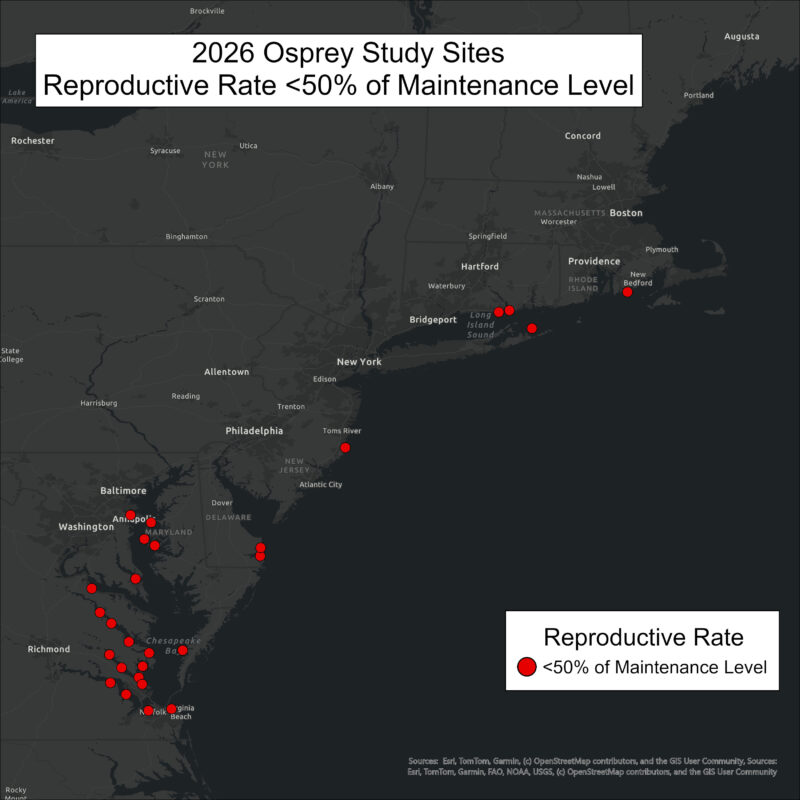
Several regions along the coast stand out for producing either very high or very low productivity. Regions reporting large deficits (<50% of requirement for population maintenance) in productivity include the Chesapeake Bay, the outer coast of Delaware and the area from the mouth of Long Island Sound to Westport River in Massachusetts (Figure 3). If these deficits continue, populations are expected to decline at an average rate of ~10%/year. Regions on the outer coast that reported good productivity include the Hilton Head Island in South Carolina, the southern coast of Connecticut and the offshore islands of Nantucket and Martha’s Vineyard in Massachusetts.
Figure 3. Distribution of study areas with large (<50% of maintenance levels) deficits in reproductive rate.
Chesapeake Bay continues to be ground zero
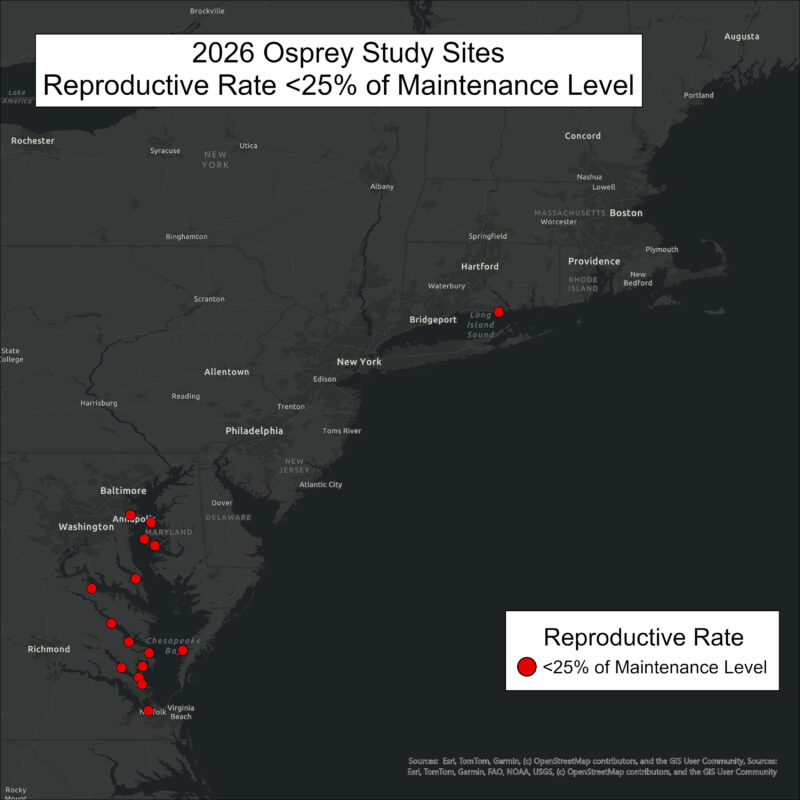
Sixteen study areas experienced extreme deficits (below 25% of maintenance levels) in reproduction during the 2026 breeding season (Figure 4). Fifteen of these sites were located in the saltier portions of the Chesapeake Bay. Based on the current demographics, we would expect the breeding populations within these study areas to decline at an average rate of ~14%/year. This annual loss rate is dramatic and without a change in course would be expected to result in a 50% decline in these population over the next decade. Ospreys within the Chesapeake Bay have been experiencing low reproductive rates for several years. Documentation of extreme reproductive deficits elsewhere along the Atlantic Coast is more recent.
Figure 4. Distribution of study areas with large (<25% of maintenance levels) deficits in reproductive rate.
Causes of Nesting Failures
Many factors may cause nest failures in ospreys including storms, predation, human disturbance and heat stress. The contribution of individual factors to nest losses varies from year to year. Many of these factors have recognizable signatures in the field. Within the Chesapeake Bay food stress is driving low reproductive rates. Broods are starving in the nest. The extreme food stress documented in recent years appears to be caused by changes in the availability of Atlantic menhaden to nesting ospreys in the Chesapeake Bay. For decades, menhaden have been considered to be a keystone prey species for the osprey population due to their high abundance, high energy density and schooling behavior. In some parts of the Chesapeake, the rate of delivery of menhaden to nests has declined by more than 80% since the 1980s. The shift in diet away from menhaden has resulted in a 50% decline in the energy content of osprey diets. The combination of a reduced rate of menhaden delivery to nests and lower energy content of the diet has resulted in an increased rate of nest failure and reduced mean brood size. The underlying causes of reduced availability of menhaden to osprey are not clear. Although the underlying cause of low reproductive rates for other study areas along the Atlantic Coast is less clear, observations in numerous study areas implicate food stress and starvation as an important driving factor.
Imperiled Species vs Ecosystem Indicator
We should view ospreys as sentinels for the marine ecosystem rather than a species imperiled.
Most osprey breeding populations throughout the world have recovered from lows driven by the DDT pesticide crisis. The North American’ population has surpassed historic benchmarks largely because pairs have colonized reservoirs created within inland areas. Ospreys appear to be secure throughout much of their range but are struggling within some coastal sites. Many of these sites have been considered to be important global strongholds for many decades. Ospreys are apex predators and are considered to be effective indicators of aquatic ecosystem health. Recent declines in reproductive rates raises a red flag on the health of marine ecosystems along portions of the Atlantic Coast.
Table 1. Results of osprey monitoring results along the Atlantic Coast for the 2026 breeding season. Reproductive rate values are means ± standard errors.
| State | Study Area | Salinity | Pairs | Reproductive Rate | Contact Person | Organization |
|---|---|---|---|---|---|---|
| NH | Lakes Region | Fresh | 20 | 1.65±0.26 | Iain MacLeod | Squam Lakes Natural Science Center |
| MA | Westport | >5ppt | 101 | 0.42±0.06 | Alan Poole | South Coast (MA) Osprey Project |
| Gina Purtell | ||||||
| MA | Buzzards Bay | >5ppt | 33 | 0.88±0.12 | ----- | OspreyWatch (Mass south coast) |
| MA | Nantucket | >5ppt | 41 | 1.41±0.13 | Libby Buck | Linda Loring Nature Foundation |
| MA | Martha's Vineyard1 | >5ppt | 125 | 1.50±0.08 | Rob Bierregaard | None |
| RI | Narragansett Bay | >5ppt | 150 | 0.78±0.06 | Sydney Brown | Audubon Society of Rhode Island |
| RI | Inland Rhode Island | Fresh | 22 | 1.09±0.16 | Sydney Brown | Audubon Society of Rhode Island |
| RI | Southern Coast | >5ppt | 31 | 1.13±0.16 | Sydney Brown | Audubon Society of Rhode Island |
| CT | Hammonasset Beach | >5ppt | 56 | 0.23±0.07 | Matt Joyce | The Connecticut Audubon Society |
| CT | Lower Connecticut River | >5ppt | 51 | 0.29±0.08 | Matt Joyce | The Connecticut Audubon Society |
| CT | New London | >5ppt | 60 | 0.52±0.10 | Matt Joyce | The Connecticut Audubon Society |
| CT | Pine Orchard | >5ppt | 74 | 0.61±0.07 | Matt Joyce | The Connecticut Audubon Society |
| CT | Upper Connecticut River | T Fresh | 28 | 0.71±0.16 | Matt Joyce | The Connecticut Audubon Society |
| CT | Inland North | Fresh | 29 | 0.86±0.15 | Matt Joyce | The Connecticut Audubon Society |
| CT | Southport | >5ppt | 31 | 1.16±0.17 | Matt Joyce | The Connecticut Audubon Society |
| CT | Southwest Coast | >5ppt | 42 | 1.17±0.13 | Matt Joyce | The Connecticut Audubon Society |
| CT | Inland South | Fresh | 52 | 1.27±0.12 | Matt Joyce | The Connecticut Audubon Society |
| CT | Silver Sands | >5ppt | 25 | 1.36±0.17 | Matt Joyce | The Connecticut Audubon Society |
| NY | Gardiners Island1 | >5ppt | 77 | 0.29±0.06 | Mike Scheibel | None |
| NJ | Ocean County1 | >5ppt | 151 | 0.51±0.06 | Ben Wurst | Conservation Wildlife Foundation, NJ |
| NJ | Cape May1 | >5ppt | 99 | 0.61±0.07 | Ben Wurst | Conservation Wildlife Foundation, NJ |
| NJ | Atlantic County1 | >5ppt | 82 | 0.61±0.10 | Ben Wurst | Conservation Wildlife Foundation, NJ |
| NJ | Sandy Hook1 | >5ppt | 70 | 0.90±0.11 | Ben Wurst | Conservation Wildlife Foundation, NJ |
| NJ | Monmouth1 | >5ppt | 63 | 1.06±0.11 | Ben Wurst | Conservation Wildlife Foundation, NJ |
| NJ | Meadowlands1 | T Fresh | 21 | 1.29±0.14 | Ben Wurst | Conservation Wildlife Foundation, NJ |
| NJ | Maurice River1 | >5ppt | 58 | 1.41±0.13 | Ben Wurst | Conservation Wildlife Foundation, NJ |
| NJ | Red Bank – DE River1 | T. Fresh | 9 | 1.89±0.39 | Ben Wurst | Conservation Wildlife Foundation, NJ |
| NJ | Harmony – DE River1 | Fresh | 11 | 2.09±0.21 | Ben Wurst | Conservation Wildlife Foundation, NJ |
| DE | South Rehoboth | >5ppt | 71 | 0.31±0.07 | Jodi McLaughlin | OspreyWatch Delaware |
| DE | North Rehoboth | >5ppt | 39 | 0.36±0.09 | Jodi McLaughlin | OspreyWatch Delaware |
| DE | Assawoman Bay | >5ppt | 21 | 0.52±0.15 | Jodi McLaughlin | OspreyWatch Delaware |
| DE | Lewes | >5ppt | 17 | 0.59±0.17 | Jodi McLaughlin | OspreyWatch Delaware |
| DE | Milford | >5ppt | 6 | 0.83±0.31 | Jodi McLaughlin | OspreyWatch Delaware |
| DE | Nanticoke | T Fresh | 8 | 1.50±0.50 | Francie Davis | OspreyWatch Delaware |
| MD | Lower Choptank | >5ppt | 26 | 0.00±0.00 | Barnett Rattner | United States Geological Survey |
| MD | Poplar Island | >5ppt | 10 | 0.00±0.00 | Bobby Callahan | United States Fish & Wildlife Service |
| MD | Severn1 | >5ppt | 35 | 0.09±0.05 | Tom Guay | Eco-Ed Endeavors |
| MD | Kent Island | >5ppt | 16 | 0.19±0.10 | Judy Wink | Chesapeake Bay Environmental Center |
| MD | Lower Patuxent | >5ppt | 44 | 0.20±0.07 | Greg Kearns | Patuxent River Park |
| MD | Lower Chester | >5ppt | 89 | 0.67±0.08 | Barnett Rattner | United States Geological Survey |
| MD | Jug Bay | T Fresh | 47 | 0.81±0.14 | Greg Kearns | Patuxent River Park |
| MD | Upper Chester | T Fresh | 31 | 1.19±0.19 | David Kramar | CES, Washington College |
| VA | Bowlers Wharf | >5ppt | 46 | 0.02±0.02 | Bryan Watts | Center for Conservation Biology, W&M |
| VA | Mattox Creek | >5ppt | 37 | 0.05±0.04 | Bryan Watts | Center for Conservation Biology, W&M |
| VA | Urbanna | >5ppt | 31 | 0.10±0.05 | Bryan Watts | Center for Conservation Biology, W&M |
| VA | Lower York | >5ppt | 51 | 0.12±0.06 | Bryan Watts | Center for Conservation Biology, W&M |
| VA | Mobjack Bay | >5ppt | 63 | 0.17±0.05 | Bryan Watts | Center for Conservation Biology, W&M |
| VA | Elizabeth River | >5ppt | 26 | 0.19±0.08 | Bryan Watts | Center for Conservation Biology, W&M |
| VA | Poquoson River | >5ppt | 29 | 0.21±0.10 | Bryan Watts | Center for Conservation Biology, W&M |
| VA | Piankatank River | >5ppt | 39 | 0.23±0.09 | Bryan Watts | Center for Conservation Biology, W&M |
| VA | Middle York | >5ppt | 33 | 0.24±0.09 | Bryan Watts | Center for Conservation Biology, W&M |
| VA | Eastern Shore Bayside | >5ppt | 61 | 0.25±0.08 | Bryan Watts | Center for Conservation Biology, W&M |
| VA | Lynnhaven River | >5ppt | 40 | 0.28±0.09 | Keriann Spiewak | VA Aquarium & Marine Science Center |
| Reese Lukei, Jr | Center for Conservation Biology, W&M | |||||
| VA | Lower James | >5ppt | 25 | 0.32±0.11 | Bryan Watts | Center for Conservation Biology, W&M |
| VA | Upper York | >5ppt | 17 | 0.35±0.12 | Bryan Watts | Center for Conservation Biology, W&M |
| VA | Upper Rappahannock | >5ppt | 33 | 0.42±0.14 | Bryan Watts | Center for Conservation Biology, W&M |
| VA | Middle James | >5ppt | 44 | 0.45±0.12 | Bryan Watts | Center for Conservation Biology, W&M |
| VA | Colonial Beach | >5ppt | 38 | 0.53±0.14 | Joanie Millward | Virginia Osprey Foundation |
| VA | Dahlgren Naval Base | >5ppt | 21 | 0.81±0.20 | Joanie Millward | Virginia Osprey Foundation |
| VA | Upper James | T Fresh | 52 | 1.04±0.16 | Bryan Watts | Center for Conservation Biology, W&M |
| VA | Dyke Marsh | T Fresh | 28 | 1.07±0.18 | Dan Rauch | Wildlife Division, Washington D.C. |
| VA | Pohick Bay | T Fresh | 38 | 1.18±0.15 | Bryan Watts | Center for Conservation Biology, W&M |
| VA | Back Bay | T Fresh | 9 | 1.67±0.47 | Reese Lukei, Jr. | Center for Conservation Biology, W&M |
| SC | North Hilton Head | >5ppt | 30 | 1.07±0.14 | Joanne Voulelis | OspreyWatch Hilton Head Island |
| Carol Clemens | ||||||
| SC | South Hilton Head | >5ppt | 23 | 1.13±0.16 | Joanne Voulelis | OspreyWatch Hilton Head Island |
| Carol Clemens |
1Reproductive estimates were based on active nests (pairs making breeding attempts) rather than all pairs in the population. These study areas underestimate breeding populations and by doing so overestimate reproductive rates.