Azalea Sleeping Around (The Catfish Ponds)
June 29, 2010Camellia on the Move West
July 2, 2010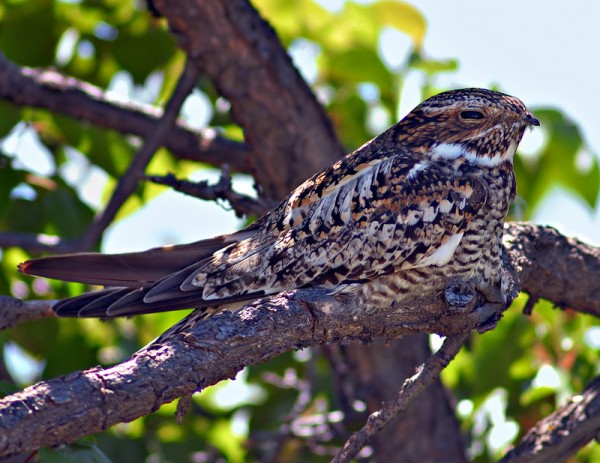
Written by Michael Wilson
July 1, 2010
For the fourth consecutive year, volunteers from across the United States set-out into the night to conduct nocturnal survey routes for the U.S. Nightjar Survey Network. The U.S. Nightjar Survey Network is a national program specifically designed to gather population distribution and trend data on the group of species like whip-poor-wills, common nighthawks, common poorwills and their close taxonomic relatives.

Common nighthawk, Comanche National Grassland Area, SE Colorado, photographed by Michael Menefee.
Over the four-year history of the program, volunteers have collected information from 534 routes and counted 2,950 chuck-will’s-widows, 1,447 whip-poor-wills, 1,083 common nighthawks, 475 common poorwills, 429 lesser nighthawks, and 67 common paraques.
These results are remarkable given that volunteers are asked to conduct surveys under some of the most difficult conditions for a national based bird survey. Most of the difficulty lies in the fact that the surveys at conducted at night and only during the brightest moonlight periods of the breeding season lunar cycle. Moonlight has been shown to positively influence nightjar calling rates and hence their detection by the survey program. On some nights, volunteers must wait until 1 or 2 am for the moon to break the horizon before setting out to blaze their survey routes.

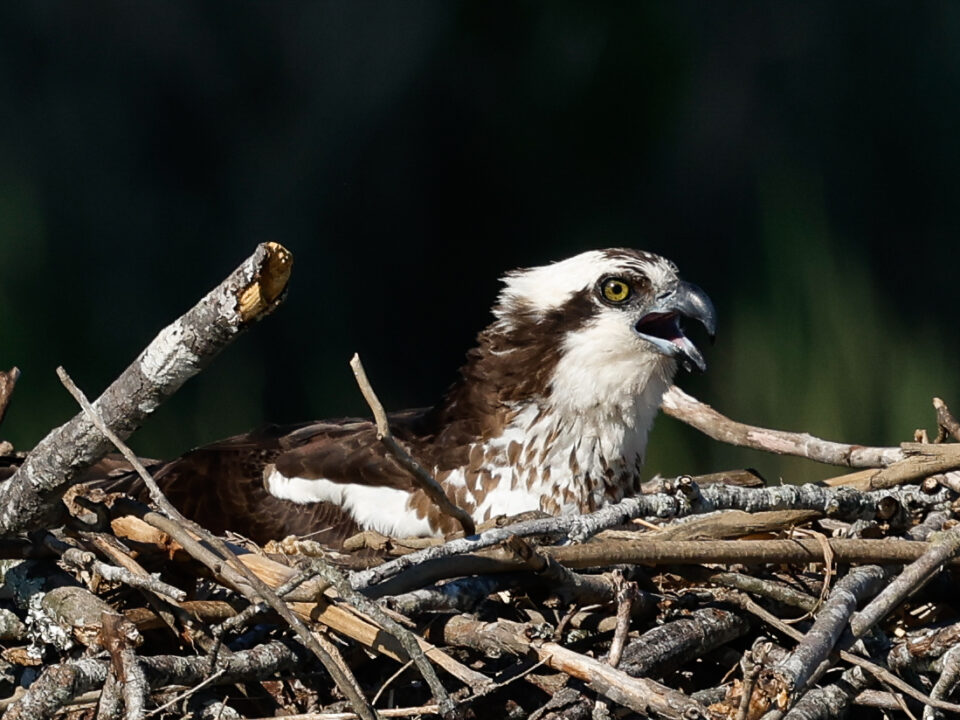
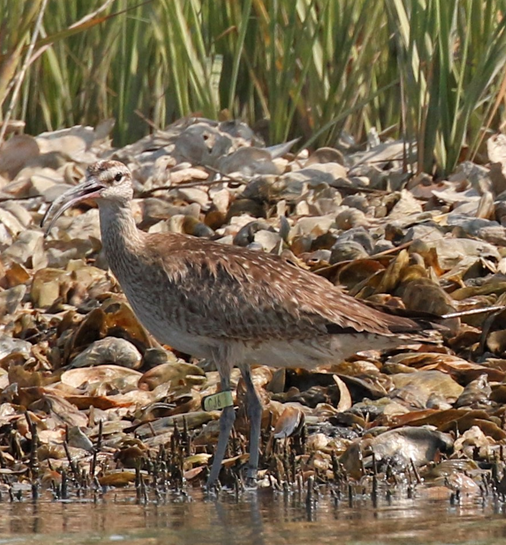
Chuck-will’s widow, photographed by Jeff Bouton in Key West, FL. Photo by Jeff Bouton, Leica Sports Optics.
The U.S. Nightjar Survey Network has both long-term and near-term objectives for collected data. Long term goals are to determine the scale and magnitude of nightjar population changes over time. Near-term goals are to determine the influence of landscape composition on nightjar abundance. Because we also digitize the landcover around each survey route into unique habitat classes we can begin to build relationships between the number of birds detected and the habitat composition of that location. Survey data collected by volunteers are already beginning to show how nightjar populations are affected by human uses of the landscape. The relationship between birds and habitat can be used to project population abundance over broader land scales. Moreover, they enable us to hindcast or forecast the abundance data to determine how populations may have changed over time and how they may fare into the future.

The distribution of 63 nightjar survey routes conducted in Florida over the past 4 years (areas colored orange) within 16-km hexagonal grid cells. See the US Nightjar Survey Network website for more details. Map by the Center for Conservation Biology.
One example of how survey data is providing groundbreaking information for nightjar management can be noticed in Florida, where volunteers have collected data on 63 different routes over the past 4 years (Figure 1). The number of Chuck-will’s-widows detected per route in Florida exhibits marked differences based on the type of landscape routes are embedded within (Figure 2). Nightjars are most abundant in naturally forested landscapes such as longleaf pine forests, moderately abundant in forested landscapes mixed with agriculture or pastureland, but show extremely reduced abundances in areas of suburban/exurban development. This information begins to provide the fundamental building blocks for land-based management decisions to conserve populations.

The relationship between the numbers of Chuck-will’s-widows detected on U.S. Nightjar Survey Network routes across a gradient landcover in Florida shows how human land use negatively affects bird abundance. Graph by the Center for Conservation Biology.
The success of the U.S. Nightjar Survey Network relies on volunteer participants to survey routes. Please consider adopting a route or forwarding information on the program to other conservation groups and agencies. For more information please visit http://www.ccb-wm.org/nightjars.htm