Understanding the tracking maps
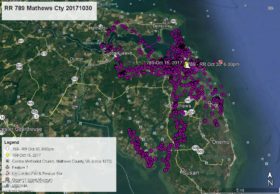
Satellite map June 29 to July 4
July 6, 2009Satellite map July 2-6
July 8, 2009A few folks have asked questions about how to decipher the map images Reese posts to the blog. Here’s a brief summary of what you are seeing:
The satellite transmitter records Azalea’s location every hour, on the hour. This is a snapshot in time. We don’t know if she is flying or perched when the location is recorded. These hourly locations are shown as red circles on the map.
The transmitter sends data to CCB every 3 days. We create maps in Google Earth which show the most recent data (3-6 days worth at a time). These are the maps being posted to this blog.
Each blog post with a map shows a thumbnail size of the image. When you click on the image, it enlarges the map. If you move your mouse to the right off the image, then move it back left onto the map image, you mouse will change into a magnifying glass. Now click on the image using the magnifying glass. This allows you to zoom into the map one more time.
There is also a map on the wildlifetracking.org website. This map will become more useful once Azalea disperses from her natal territory and begins to explore the Chesapeake Bay region.
Hope this helps!
Libby Mojica
Center for Conservation Biology


3 Comments
Thanks so much to everyone who provides this great service. It’s been so great to watch these eaglets grow. I tried moving off the map image to the right but don’t get another magnifier – it goes back to the original image.
Thank you so much for all the info.
Clears up a lot of questions
Audrey
When you click on the map it will enlarge. It will magnify the area you click on one time when you see the plus sign. It will go back to enlarged size if you click again. Move the plus sign to another area of the map and click again and it will magnify that area.